Professional Services
IT Cost Optimization
Strategic IT Cost Optimization and Financial Governance
Reduce your IT costs while structuring sustainable governance.
Through a pragmatic approach, based on solid levers and market benchmarks, you achieve quick and sustainable gains while strengthening your Target Operating Model (TOM).
Focus: OPEX under pressure?
In 10–90 days: visibility on potential savings, 2–3 levers activated with no freeze or supplier conflict.
12% OPEX reduced (real case) with zero disruption
Light governance & economic proof
Contracts reframed around outcome-based SLAs
Immediate reduction of IT OPEX through concrete and validated levers.
Strengthening of financial and contractual governance.
Full visibility on costs and budget variances.
Realistic roadmap towards a hybrid and scalable TOM.
Leverage existing tools (FinOps, JIRA, etc.) without a full replatform.
Scoping & data collection: Collection and analysis of existing budgetary, contractual, and operational data to establish a precise baseline.Budget diagnosis and benchmark: Comparative analysis against market standards and identification of financial performance gaps.Quick wins identification and performance levers: Detection of immediate optimization opportunities and medium-term performance levers.Contract renegotiation strategy: Definition of renegotiation strategies and optimization of existing supplier contracts.Governance strengthening: Implementation of FinOps tools, monitoring KPIs, and IT procurement validation processes.TOM roadmap & executive presentation: Presentation of the Target Operating Model and transformation roadmap with an executive brief.
IT OPEX diagnosis & gap mapping
FinOps dashboard (economic & operational KPIs)
Optimized action plan with 3 horizons (short / medium / long)
TOM roadmap (IT delivery target model)
Migration scenarios (e.g., dedicated M365 tenant, infrastructure rightsizing)
Strategic recommendations (e.g., IFRS16, Gainshare)
% OPEX reduction over 12 months
Number of activated levers
Average implementation time per lever
IT OPEX as % of revenue (vs benchmark)
TOM maturity (Run / Build / Governance)
Rate of rationalized expenses outside the IT department
Banks or group subsidiaries (regional alignment)
IT departments under strong budget pressure
CIOs seeking to structure governance without massive replatforming
Companies in transformation phase or DORA/GDPR audit
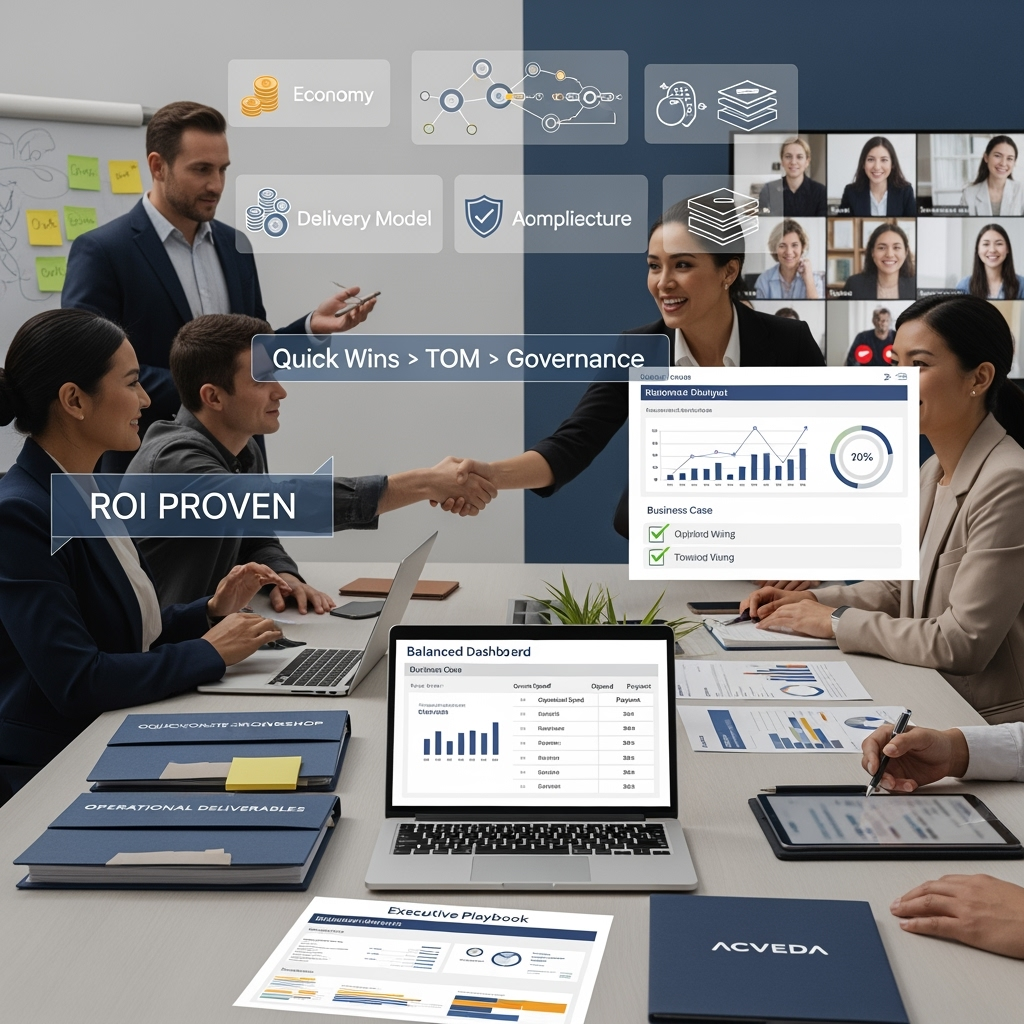
Proven experience with demonstrated ROI
Hybrid approach: Quick Wins + TOM + governance
Ability to articulate economics, delivery model, compliance, architecture
Operational deliverables usable by decision-makers